The Chartopia Editor
This guides contains more in depth information about the Chartopia editor. It's recommended to read the quick start guide first, or to watch some of the tutorial videos.
Linked charts
A Linked Chart is another chart (either a subchart or another root level chart) that is called/rolled upon from a source chart. For example, if one has a table of first names and a table of last names, both of these can be rolled on their own. However, one could create a separate table called ‘Random Names’ that is able to roll on both the first name and last name table and combine the result.
Advantages include:
- Reuse of tables
- Allows tables of different lengths to be used together. I.e. the first name table could have had 100 possibilities but the last name table may have had just 20.
Example
Take two tables called "First Names" and "Last Names"
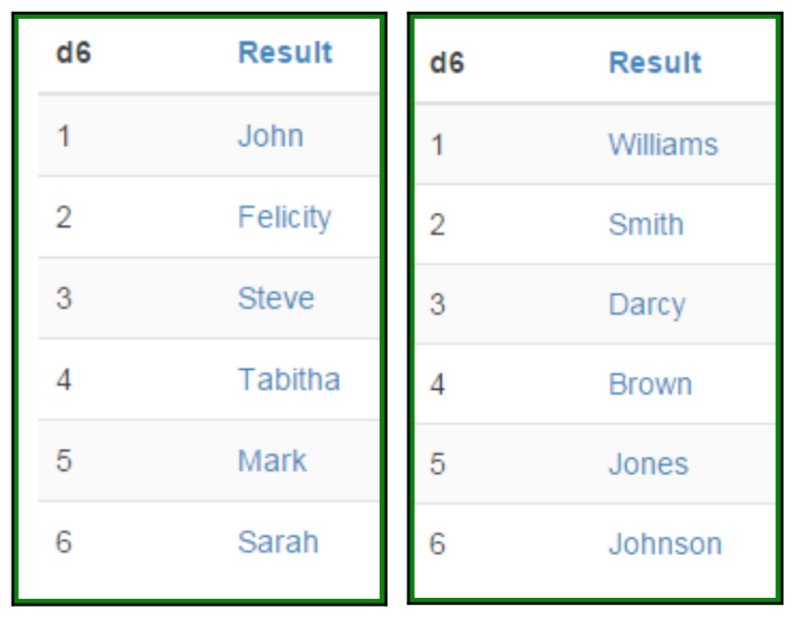
Both of these tables can be rolled independently, however, both can be utilised in a "Simple Name Generator" table that will combine both the first name and last names together in the event of a dice roll. You can link the charts together by searching for and adding a linked chart via the result editor.
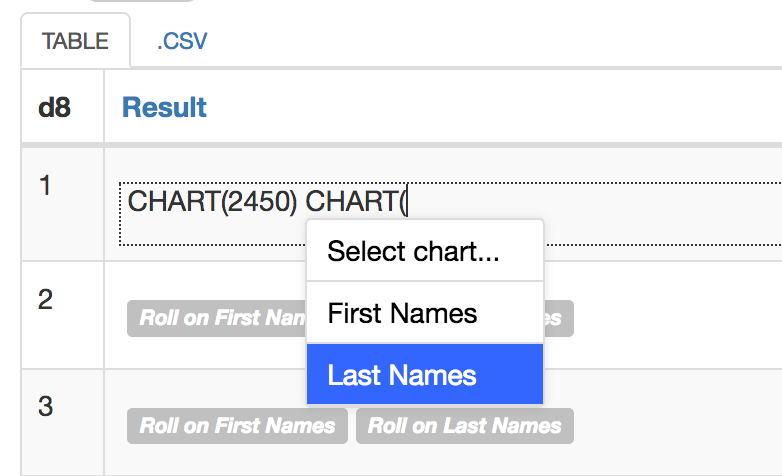
Searching and adding for charts to link against can be achieved by adding the text chart( at which point a popup will reveal both; possible subcharts to link to, and a means of opening a dialog that can be used to search the Chartopia library.
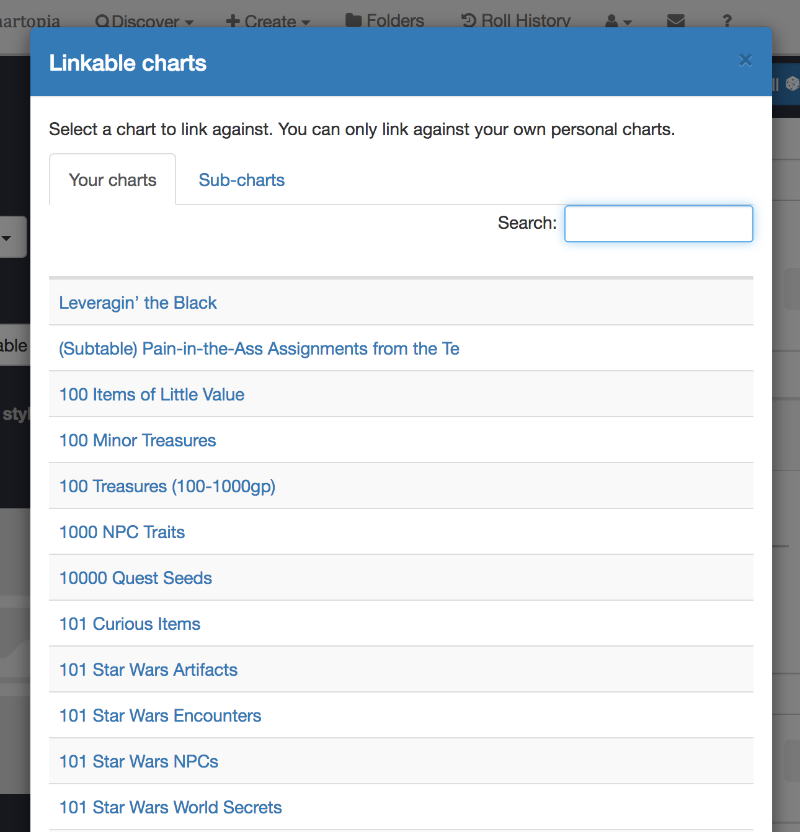
By pressing the "Select chart..." option, the following dialog will be shown, providing a means to linked to charts from your wider collection, and not just the subtables for this chart.
By inserting the table 'First Names', then adding a space before inserting the table 'Last Names', it will look like something like the following:
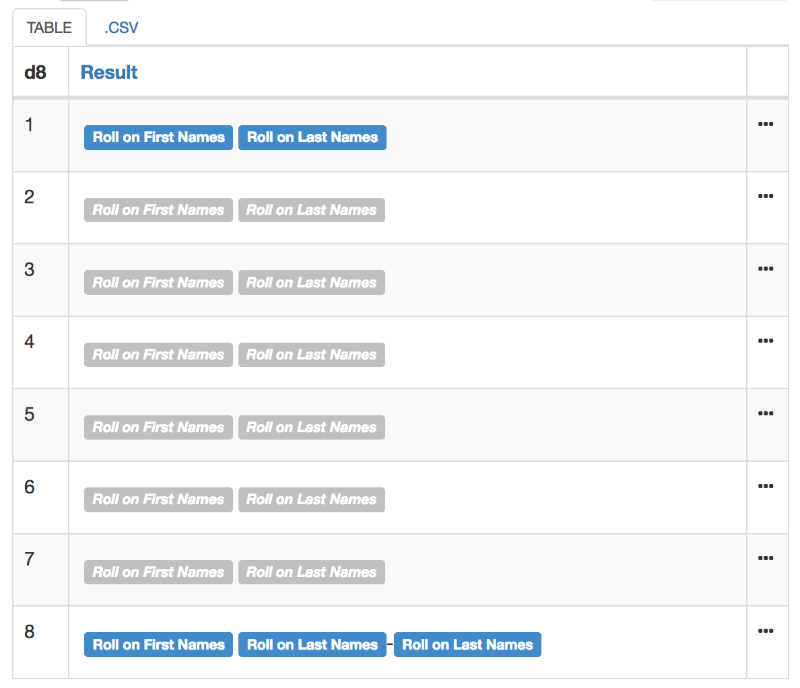
Note:
- Result data was only required for values 1 and 12.
- Value 1 is a First Name + Last Name.
- Value 12 provides a 1 in 12 chance of getting a hyphenated last name.
NB: It is possible to link a table back to itself but there is a loop limit to prevent infinite loops.
NB: It is possible to link to any public or unlisted charts in Chartopia, as well as your own private charts. We encourage the community to share their amazing content so that it can be used by others.
Chart Name Resolution
Charts can link to other charts with either IDs e.g. CHART(123) or names e.g. CHART("name"). Using names is useful for when a name is dynamically constructed via variables; sometimes using them is just a personal style preference.
Using names to identify a chart, however, runs the risk of name collisions. For this reason, a set of name resolution rules are in place to allow Chartopia to determine the correct chart to roll on.
Name resolution preference order:
- If a chart links to itself, then it will roll on itself regardless of identically named charts in the library. (Essentially a
REROLL()). - A chart will always prefer a chart from its hierarchy (i.e. within its parent chart and subchart group), even if there are other identically named charts in the library. If there are multiple charts within the hierarchy with the same name, then there will be an error.
- If a chart links to a non sub-chart outside of the chart's hierarchy, then it will prefer a chart owned by the same user as that chart. If the user has non-subcharts with the same name, then there will be an error. e.g. if a user, Joe, rolls on a chart A owned by Jane, then chart A will prefer a chart owned by Jane (so long as there are no duplicates).
- If any of a user’s charts links to any other public chart in the Chartopia library, then it will succeed only if the name is unique, and if the chart is not private to the owner, else there will be an error.
Note:
- It’s risky to link to charts by name because if the linked to chart changes its name, or another chart is given the same name, then the link will break. It’s recommended to use IDs when calling charts that are outside of a parent chart, subchart hierarchy.
- When editing, an auto-saved revision of a chart within the hierarchy may be used if it is more recent than the published version of that chart.
- It’s impossible to roll on a subchart of another table, regardless of owner.
Default roll result formatting
By default, a table's rolled result will display the column header and associated table cell text vertically. i.e. column title, then, on a new line, the resulting text.
This is called the dice roll render style, and can be set in the chart editor.
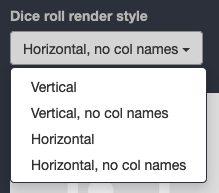
- Vertical
- Displays the column header first, then displays the result text on a new line. Multiple column will continue to render vertically as if they're separate paragraphs.
- Vertical, no col names
- Displays the result text from each column on a new line. The column names are ignored.
- Horizontal
- Displays the column header, then the result text immediately after, as if like a sentence.
- Horizontal, no col names
- Result text from each column displays like a sentence, with no column names displayed.
When one charts rolls on another (linked) chart, the render style set on the linked chart is the default. For example, if chart A rolls on chart B, but chart A is set to roll Vertical and chart B, Horizontal, then, at the point where chart B's result text is added to the overall rolled result, the text will flow in a sentence like way.
This default behaviour can be overridden using the render_style argument, e.g. CHART(id=123, render_style="vertical_no_col_names")

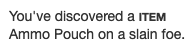
When editing the "Loot" table there is an option for how you would like it to display when used by other charts.
For example, here are two potential ways to display the result of rolling this chart row:
With Vertical
Notice that the column name is on the preceding line. Using shift-enter before CHART("Loot") will force it to be on the next line.
Or with Horizontal, no column names

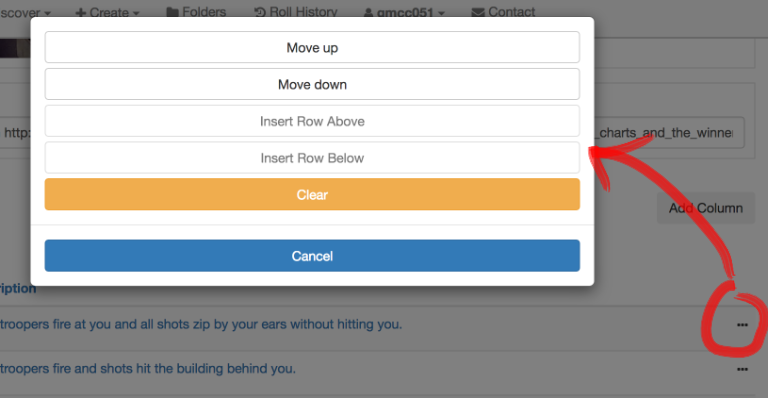
Adjusting row positions
All rows can be drag-dropped within its own table by using the dice-value table cell as the drag handle.
Additionally to drag-drop, there are basic functions for adjusting row positions and state. It is possible to shift a row up, down, or insert rows above or below a specific row. It's also possible to clear an entire row so that it infers results from the row above.
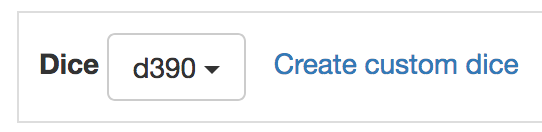
Dice values
Setting a new dice combination for the table will update the number of table rows automatically. There are preset dice combinations available i.e d4, d10, d12 etc but it's possible to create a custom combination in the format is either AdX or dX, where A is the number of dice to be rolled, and X is the number of sides on any dice. (for example d14 will roll a single 14 sided-die, 34d7 will roll 34 seven-sided dice, etc.)
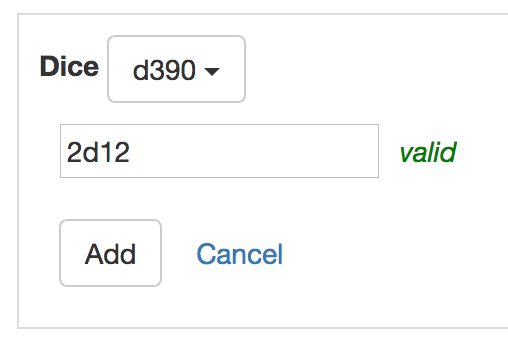
One addition operand can be included to extend the format to AdX + BdY. e.g. the following are possible:
- 2d12
- d12 + 4
- 2d12 + d6
- 2d12 + 3d6
Note the maximum number of rows a table can have in 1000 so any combination that could reach beyond this value is forbidden. e.g. 100d100 is not valid because it’s max rows is 10,000.
Note also that certain dice combinations will make certain rows unreachable. A 3d12 table has a range of 3-36 making rows 1 and 2 unreachable when rolling on the table. These rows can still be edited but will be grey to represent their unreachable status.
Template editing mode
While your chart is either empty, or has only data in the first cell, its possible to change "Edit mode" (via the left side bar) to "Template". This activates a special editing mode that offers a variety of tools specifically for creating a 'generator'.
Chartopia has always been able to replicate the idea of a non-table type generator by setting the dice type to d1. Behind the scenes, a template edit mode works in the same way but the UI makes it easier to apply a richer variety of structured formatting.
Chartopia PHB Templates
The template editor provides useful 'players hand book-esque' templates to add to the editor. They may look familiar too you from your existing print literature.
The benefit of the editor is it's now much easier to create a random NPC, random spell or random class by using the structure of a players hand book template, but with the features of the Chartopia domain Language.
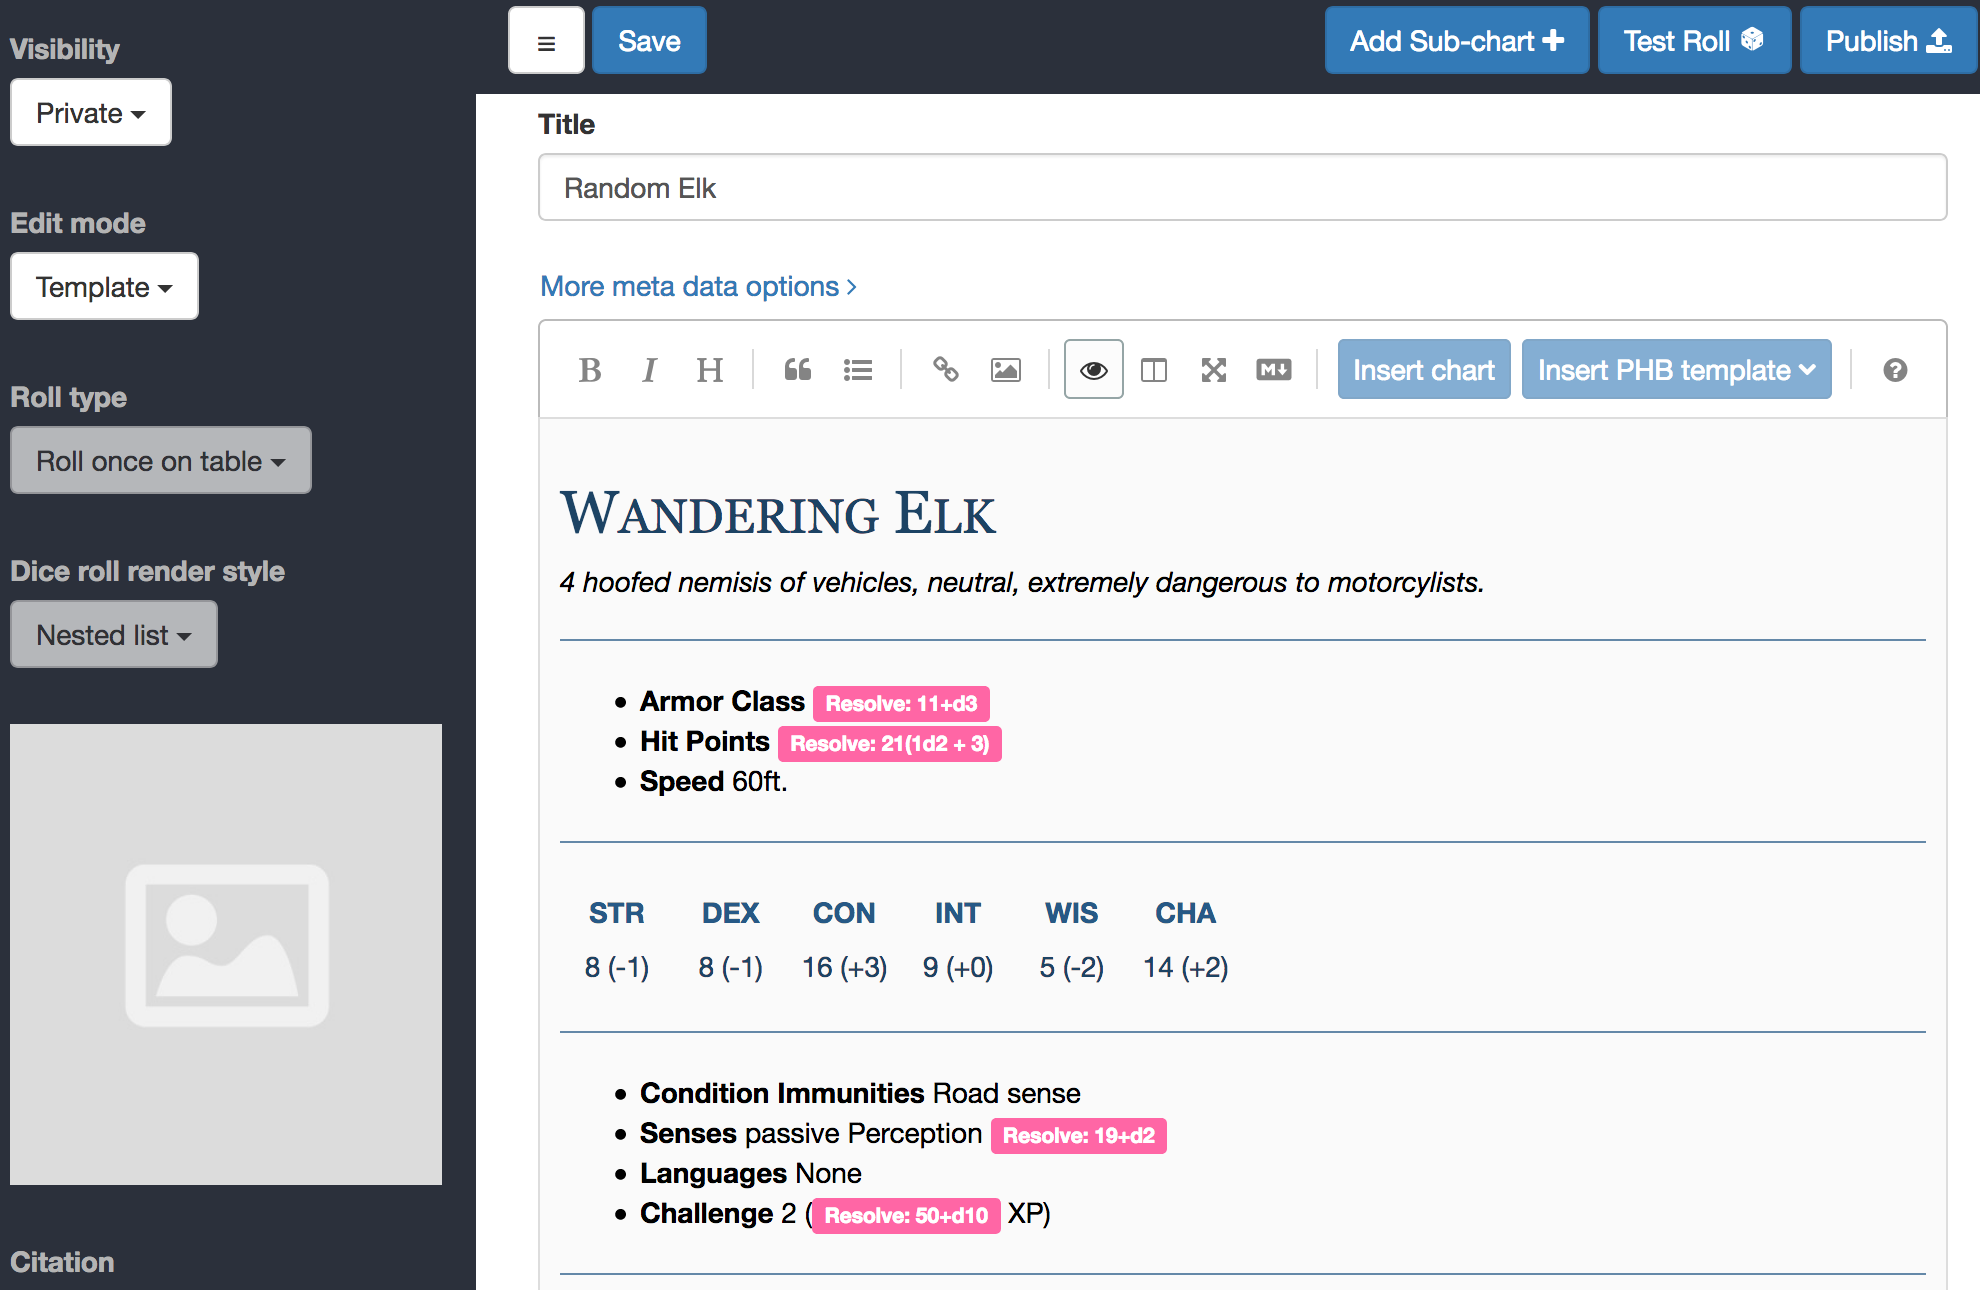
Unlike inline editing of tables which uses a rich-text editor, the template editor uses Markdown. The following screenshot shows a 'preview' of the 'monster stat block' template after bring selected from the "Insert PHB template" dropdown.
NB: Chartopia endeavours to use GFM style markdown (i.e. github markdown) for line break rules. In standard Markdown, a line break is achieved by ending a line with space+space+enter. Enter+enter creates a new paragraph. GFM markdown on the other hand should do a line break with a simple enter press.
Refer to this cheat sheet for more info.
NB: Until recently, all editing in Chartopia was done via markdown, although editing was done via a popup and couldn't be done directly to the table. Markdown is our preferred format, so we will endeavour to create a markdown inline-editor for tables in the future.
Markdown doesn't have a syntax for scaling images. If you'd like to scale an image, the following syntax can be used.
<img src="https://i.imgur.com/someimg.png" width="50%">