A Quick Start Guide to the Chartopia Editor
Introduction
Welcome to Chartopia! You’ve made your first steps into a new world of random table and random generator creation.
With this guide, we hope to be able to lead you on a journey of creativity that can be used for not just role playing games, but any kind of world building, game mechanic actions, or even note taking.
Random Tables
Chartopia has been made in the spirit of classic random tables found in published literature. That’s why the editor defaults to a d12 table ready for you to jot down ideas.
Chartopia can be a random generator too, but for now, this quick start guide will demonstrate how to make your own random table for a tabletop RPG use case.
Make your own table
This example will be using some crowd sourced data from Experience Points' twitter community. They collated a number of teleportation mishap locations that were inspired by season 5 of their All Hail Yog real-play D&D 5e podcast. If you like the idea of a PC diabolical evil campaign, then this is your podcast.
Create a new random table
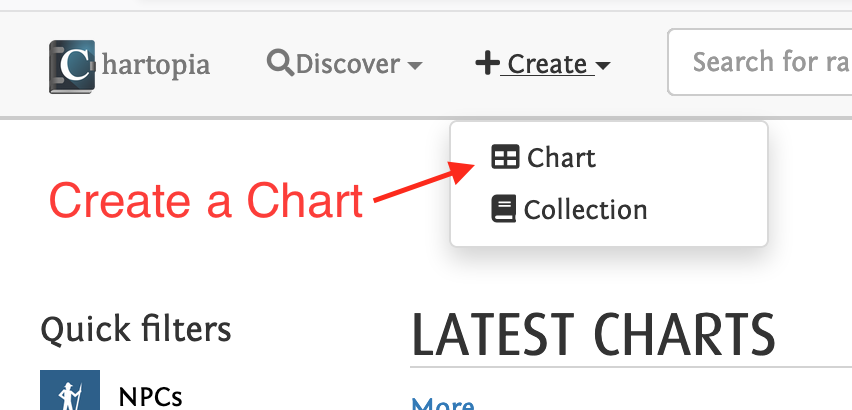
Once you’ve created an account with Chartopia, you can create a table by going to Create > Chart
Enter data manually
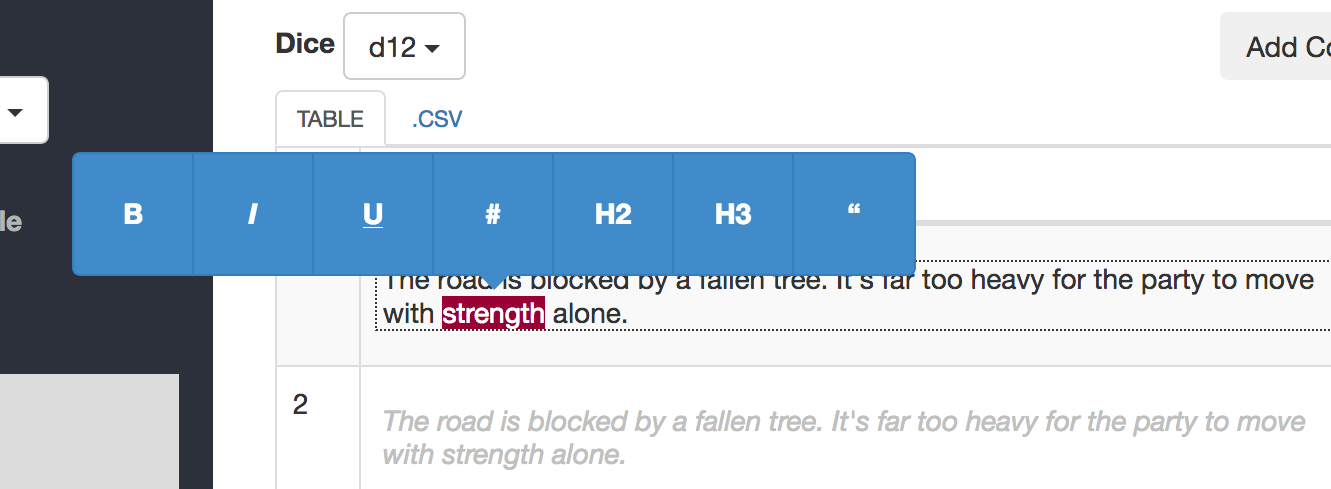
To enter data into the random table, click on a table cell and start typing.
Chartopia’s editor supports Markdown, so you can use Markdown syntax to add basic formatting such as bold, italics and bullet points. Alternatively, by highlighting text, a popup can be used to apply basic formatting. Note that it's impossible to have a table cell that is just white space. The text empty will be used as a placeholder.
Tip: As a shortcut to edit neighbouring table cells, press ctrl+alt+arrow keys (NB: currently only works when Chartopia domain language features aren't present in the cell).
Inferred rows
By default, a new chart is a d12 random table with a single column called Result and a row 1 value of empty. Notice how rows 2-12 are all inferred. Inferred values are automatic/implied copies of the previous row.
Inferred rows serve two purposes:
- It avoids copy paste by auto filling data to either the end of the table or to the next occupied table row (whichever is first).
- When the chart is viewed outside of the editor, the dice value column will collapse inferred rows together to form dice ranges. e.g. 1-4 = copper, 5-8 = silver, 9-11 = gold, 12 = platinum.
Test your result
Before you get too far entering an entire d100, be sure make a few test rolls using the Test Roll button.
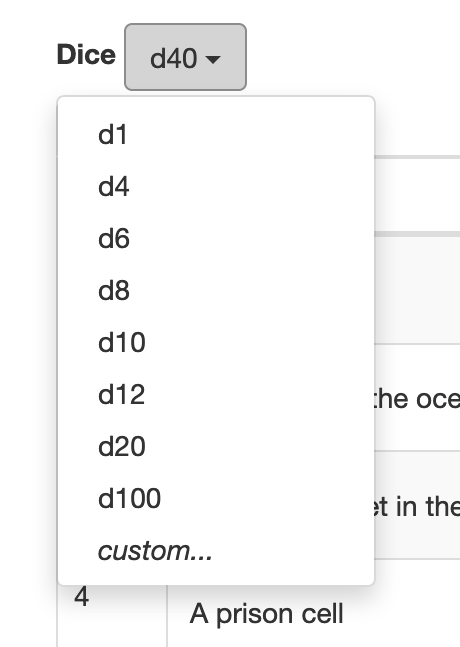
Change the table size
If the default d12 isn’t enough rows, you can add more by adjusting the dice value for the chart. Just like in books, you can set non-linear dice probability such as 2d6 or 3d4.
Enter data via .csv import
If you’re someone who’s previously stored all their random tables in spreadsheets, you’ll want to make use of the .csv importer. The importer will make a best guess as to how your .csv has been formatted. Copy pasting data from Google Docs works really well.
Add some meta data
Every chart needs a title, so be sure to add one along with other meta data such as a description, perhaps a ruleset if your table is perhaps focused on a particular game system.
Don’t forget to add some cover art, it looks really good in search results and be sure to add some tags to help the Chartopia search engine make your content easier for others to discover.
Most importantly, if you’ve sourced your random table for the internet, or a book, or even from a hodge-podge of sources, be sure to list them in either the description or the citation field.
Under the title there is an option to reveal more metadata settings, such as a more detailed description and the ability to set the rulesets/game-systems the chart may be appropriate for.
Visibility
By default, your chart is private to you and you alone. It will show up in search results while you’re logged in, but no other user will be able to find or use your content while it is set to private.
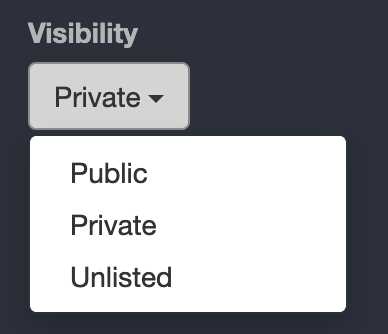
But we at d12dev encourage you to share your original creations. You can set your chart to be either public, so that anyone can search for or use your chart, or unlisted, whereby the url is required to access the chart.
- Private
- Only you can search for, view and roll on this chart. It will not be inaccessible by any other users
- Public
- All users can search for this chart, view it and roll on it.
- Unlisted
- An unlisted chart is public, but does not show up in search results. This is a useful way to share the url with others, but preventing it showing up in wider searches.
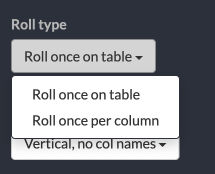
Roll type
Roll type specifies whether a roll will be done once per row, or once per column.
The default is to roll once per row, but a common practice in roleplaying literature is to condense random tables by rolling once per column. If you'd like to replicate this scenario, select "Roll once per column".
To configure how the result should be rendered, refer to default roll result formatting
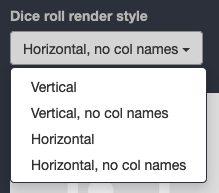
Change the default formatting
When rolling on a random table, by default, Chartopia will rendering the columns and row content vertically whereby the columns are styled to be bold. There are some other pre-defined dice roll rendering styles to choose from, such as printing each cell of a table horizontally with no column titles, as if it were a sentence.
These are just some presets, but it’s possible have fine control over how your rolled results are rendered, but that is out side the scope of this quick start guide.
Auto-save and Publishing
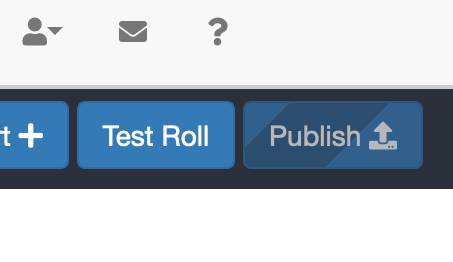
Have you noticed your chart auto-saving? Auto-save is useful for those times you accidentally make the browser go back a page. None of your changes will be visible out side of the editor, so once you’re happy with your changes, be sure to press the Publish button.
Another benefit of autosave, is that it allows you to have a published version of your chart live for everyone to use but still allowing you to make subsequent edits. Don’t forget to re-publish when done.
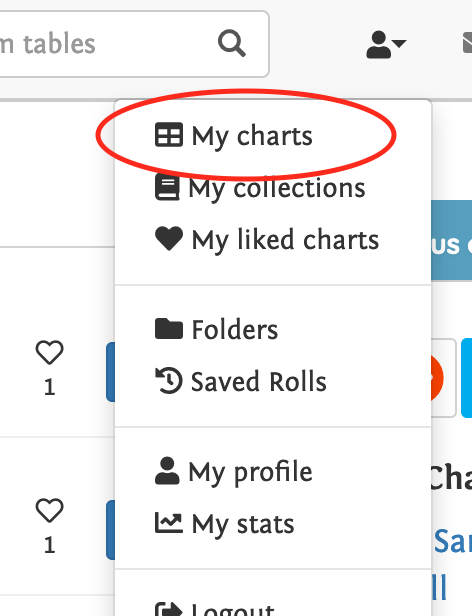
Review your published Chart
Be sure to return to the main page to look for your chart to see how it will look to other users. If you go to the main Chartopia page, you can quickly see all your own charts by selecting the profile icon in the navigation bar and selecting “My charts”.
Language Features
Chartopia has it’s own template language, meaning it’s possible to create random tables that are not just text, but instructions to create even more randomness. Features like small, nested lists can be achieved with something as simple as {gold|silver|copper} and equations can be done with {2d12+2}.
These are very simple examples, but Chartopia has a lot of functionality typical of a programming language such as variables, loops, arrays and conditions. That is outside outside the scope of this quick start guide so be sure to check out the Chartopia domain language documentation to learn more.
There’s so much more
Chartopia has folders, tagging, collections, printing, export and more. Eventually the documentation will expand to cover these great features, but for now, feel free to check out the docs, perhaps ask us a question on reddit, Twitter or Facebook, or even checkout the YouTube channel.
Naturally, we also appreciate any and all support. There’s only the two of us working on Chartopia, and we love finding out what you’ve been using it for.